WaveNet
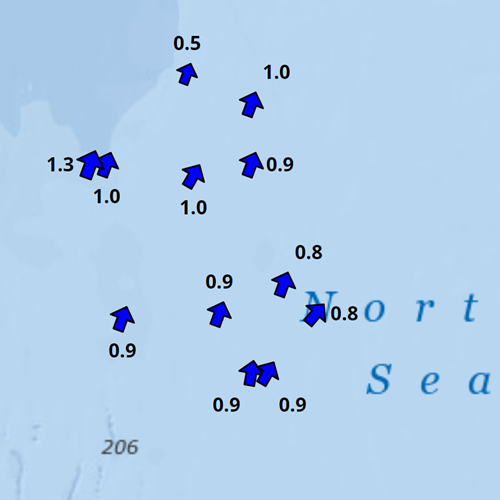
WaveNet, Cefas’ strategic wave monitoring network for the United Kingdom, provides a single source of real-time wave data from a network of wave buoys located in areas at risk from flooding.
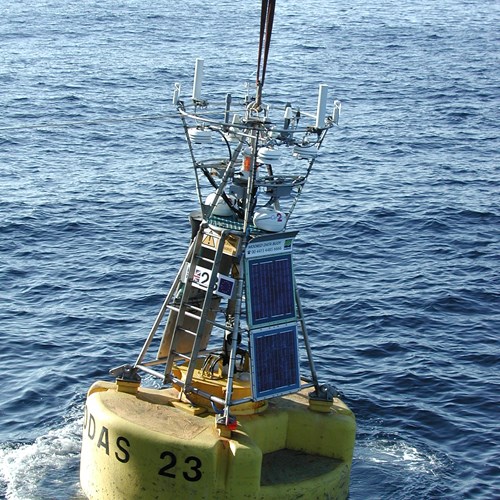
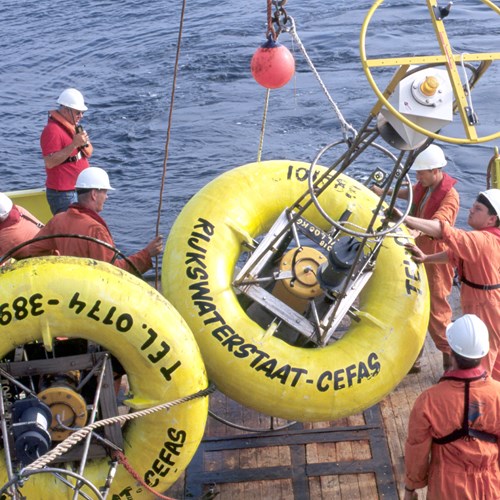
In operation since 2002, WaveNet collects and processes data from the Cefas-operated Datawell Directional Waverider buoys, tethered at strategic locations around the UK coastline. The WaveNet system also gathers wave data from a variety of third party platforms and programmes (industry and public sector-funded), all of which are freely available for visualisation on the WaveNet website.
Cefas sends the wave data to the Met Office (to help improve the wave and tidal surge model) and the National Flood Forecasting Service for access by the UK Coastal Flood Forecasting Service (UKCFF). Regional flood forecasters, local authorities and other stakeholders use the near-real time data from the buoys and the model predictions to provide better advice, guidance and warnings to emergency responders and communities about imminent coastal flood risk.
On a longer timescale, the data can provide coastal engineers and scientists with a better understanding of the wave climate when designing coastal flood defences and as evidence for climate change studies.
Some data are available for download from the WaveNet website; the procedure to access the data archive is available below. Please also see the Data Policy page for guidance on any restrictions on the use of the data.


Funded By:

![]()
In Association with:
![]()
![]()

![]()
![]()
![]()