DOI: 10.14466/CefasDataHub.134
Vanuatu Water Quality Dataset - CTD Profiles - 2016-2018
Description
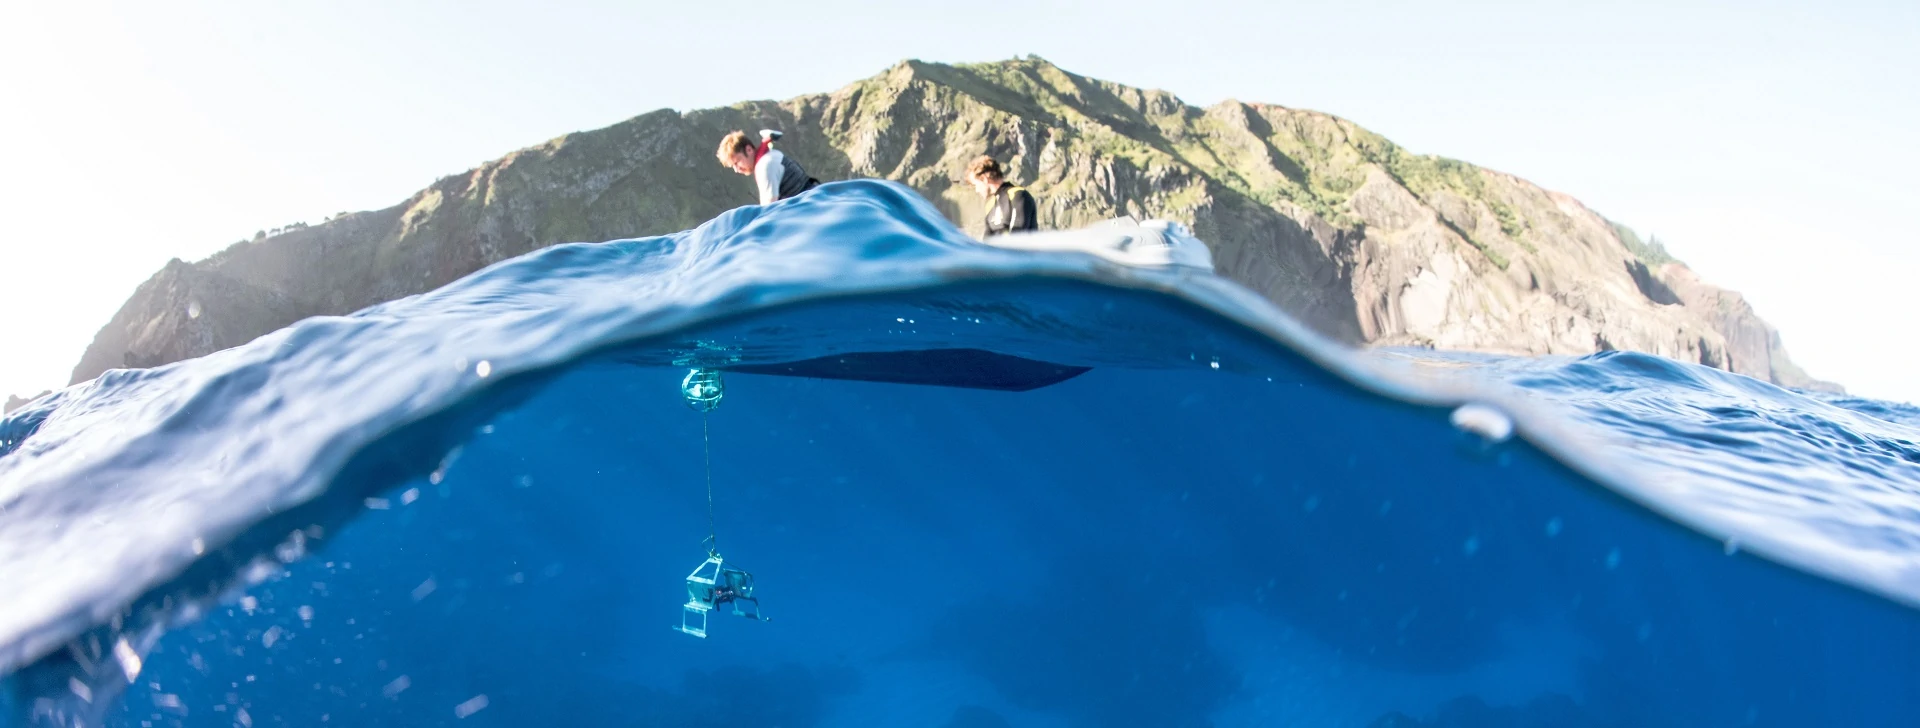
CTD depth profiles from a dataset supporting a baseline assessment of marine water quality around Vanuatu, South Pacific. As part of the Commonwealth Marine Economies Programme, water quality measurements were collected over three years in the coastal waters around the island of Efate, and on one occasion around the island of Tanna. Observations focus on Port Vila (Efate), which is the main urbanised area on the Island. Parameters included are: salinity, temperature, turbidity, light attenuation, dissolved oxygen, and chlorophyll (fluorescence) which represent part of a larger research program on water quality, human health and habitat mapping. Associated data can be found here: Devlin et al (2020). Vanuatu Water Quality Dataset - 2016-2018. Cefas, UK. V1. doi: https://doi.org/10.14466/CefasDataHub.107 Depth profiles were obtained using the Cefas ESM2 profiler for T1 and T2 (Sivyer et al., 2016), using an RBR Maestro3 for T6, and an RBR Concerto3 for T9 (RBR Ltd. Canada). Sensors equipped were as follows: FSI CT (ESM2; Falmouth Scientific Inc., USA) RBR Marine CT (Maestro and Concerto); Seapoint STM Turbidity (Seapoint Sensors Inc., USA; all profilers); Aanderaa 4330F Optode (Aanderaa Data Instruments AS, Norway; ESM2), RBRcodaODO|fast8 (Maestro) and RBRcodaT.ODO (Concerto) oxygen optodes; Seapoint (RBR) and Turner Cyclops (Turner Designs Inc., USA; Maestro) chlorophyll fluorometers and Li-Cor LI-192 PAR (LI-COR Biosciences USA; ESM2 and Maestro). Sensor data obtained from the Maestro CTDs were analysed using RBR Ruskin Desktop software and RBR’s RSKtools Matlab post-processing tool kit. Depth profiles were extracted in Matlab using the RSKtools package. Processing included: removing salinity spiking by calculating and applying a correction for the time-shift between conductivity and temperature sensors; recalculation of practical salinity and calculation of density anomaly (sigma0, presented here as ‘density’) using the integrated tools from the TOES-10 GSW toolbox; removing loops in profile ascent and descent (identified by reversed sensor velocity); and smoothing (boxcar) with a filter window of 3. Anomalous values at the top and bottom of profiles were manually removed for all channels, where present. Very high chlorophyll values at the bottom of the profiles were removed. While these may have been due to the sensor approaching high chlorophyll particles near the seafloor, they represented discontinuities from the rest of the profiles. All sensors were operated using their factory calibration. The oxygen sensor calibration was checked by pre-and post-survey two-point calibration, which while sub-optimal for these sensors (ideally be calibrated daily in-situ), provides a lower-precision overview of the oxygen conditions and a consistent picture across surveys. Ideally, calibration checks of the oxygen optode would have been carried out daily in the field. The values presented are therefore to be taken as approximate. Similarly, the factory calibration of the chlorophyll fluorescence sensor is not expected to be appropriate for the specific phytoplankton communities of the study area and data therefore indicate relative changes in chlorophyll only. Additional sampling site information and parameters determined from surface water samples are available at Devlin et al. (2020a). These data are presented in Devlin et al. (2020b).
Contributors
Devlin, Michelle J. / Smith, Andy J. / Graves, Carolyn A. / Maniel, Michael / Hooper, Eryn / Graham, Jennifer A. / Lyons, Brett P.
Subject
Coastal environment / Dissolved oxygen parameters in the water column / Light absorption in the water column / Monitoring / Optical backscatter / Raw fluorometer output / Raw oxygen sensor output / Raw suspended particulate material optical sensor output / Raw temperature and/or salinity instrument output / Salinity of the water column / Suspended particulate material / Structure and stability of the water column / Temperature of the water column / Transmittance and attenuance of the water column / Water column temperature and salinity
Start Date
06/05/2016
End Date
06/12/2018
Year Published
2022
Version
1
Citation
Devlin et al (2022). Vanuatu Water Quality Dataset - CTD Profiles - 2016-2018. Cefas, UK. V1. doi: https://doi.org/10.14466/CefasDataHub.134
Rights List
DOI
10.14466/CefasDataHub.134
Data Links