Station 33
Skomer Island
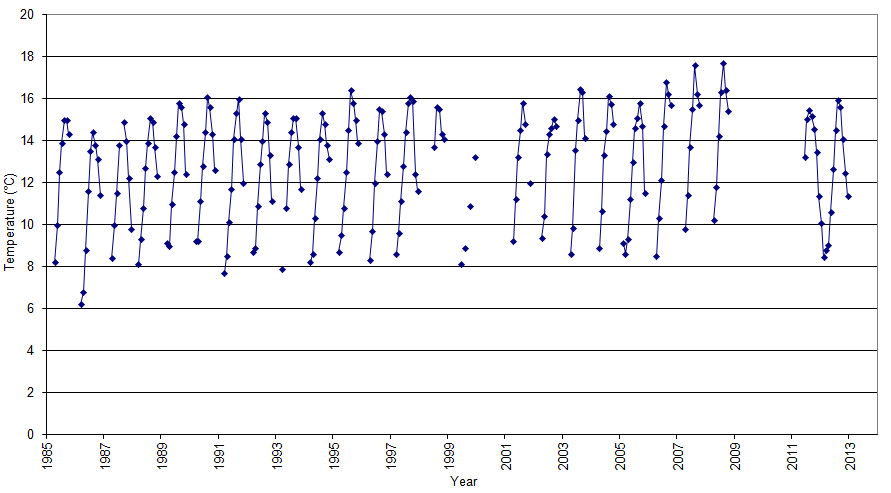
Figure 'a': Monthly mean surface temperature for the entire duration of the record at the station which are derived from simple averaging of all the monthly data.
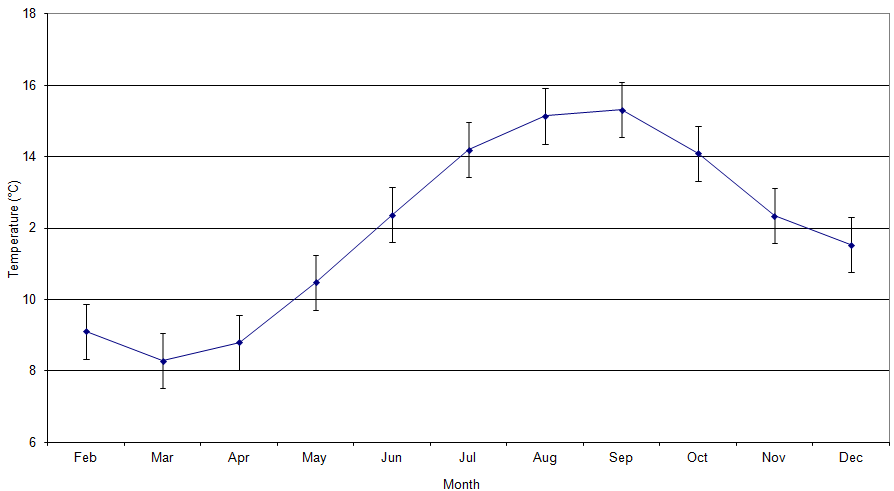
Figure 'b': Monthly climatic average with the first standard deviation. The standard deviation has been derived from the difference in the monthly average from the long-term mean (1971 - 2000).
Monthly Mean Sea Temperature for SKOMER ISLAND at 51° 44' N, 5° 17' W
| Year | Jan | Feb | Mar | Apr | May | Jun | Jul | Aug | Sep | Oct | Nov | Dec | |
|---|---|---|---|---|---|---|---|---|---|---|---|---|---|
| 1985 | 8.2 | 10.0 | 12.5 | 13.9 | 15.0 | 15.0 | 14.3 | ||||||
| 1986 | 6.2 | 6.8 | 8.8 | 11.6 | 13.5 | 14.4 | 13.8 | 13.1 | 11.4 | ||||
| 1987 | 8.4 | 10.0 | 11.5 | 13.8 | 14.9 | 14.0 | 12.2 | 9.8 | |||||
| 1988 | 8.1 | 9.3 | 10.8 | 12.7 | 13.9 | 15.1 | 14.9 | 13.7 | 12.3 | ||||
| 1989 | 9.1 | 9.0 | 11.0 | 12.5 | 14.2 | 15.8 | 15.6 | 14.8 | 12.4 | ||||
| 1990 | 9.2 | 9.2 | 11.1 | 12.8 | 14.4 | 16.1 | 15.6 | 14.3 | 12.6 | ||||
| 1991 | 7.7 | 8.5 | 10.1 | 11.7 | 14.1 | 15.3 | 16.0 | 14.1 | 12.0 | ||||
| 1992 | 8.7 | 8.9 | 10.9 | 12.9 | 14.0 | 15.3 | 14.9 | 13.3 | 11.1 | ||||
| 1993 | 7.9 | 10.8 | 12.9 | 14.4 | 15.1 | 15.1 | 13.7 | 11.7 | |||||
| 1994 | 8.2 | 8.6 | 10.3 | 12.2 | 14.1 | 15.3 | 14.8 | 13.8 | 13.1 | ||||
| 1995 | 8.7 | 9.5 | 10.8 | 12.5 | 14.5 | 16.4 | 15.8 | 15.0 | 13.9 | ||||
| 1996 | 8.3 | 9.7 | 12.0 | 14.0 | 15.5 | 15.4 | 14.3 | 12.4 | |||||
| 1997 | 8.6 | 9.6 | 11.1 | 12.8 | 14.4 | 15.8 | 16.1 | 15.9 | 12.4 | 11.6 | |||
| 1998 | 13.7 | 15.6 | 15.5 | 14.3 | 14.1 | ||||||||
| 1999 | 8.1 | 8.9 | 10.9 | 13.2 | |||||||||
| 2000 | |||||||||||||
| 2001 | 9.2 | 11.2 | 13.2 | 14.5 | 15.8 | 14.8 | 12.0 | ||||||
| 2002 | 9.4 | 10.4 | 13.4 | 14.3 | 14.6 | 15.1 | 14.7 | ||||||
| 2003 | 8.6 | 9.9 | 13.6 | 15.0 | 16.5 | 16.3 | 14.1 | ||||||
| 2004 | 8.9 | 10.6 | 13.3 | 14.5 | 16.1 | 15.7 | 14.8 | ||||||
| 2005 | 9.1 | 8.6 | 9.3 | 11.2 | 13.0 | 14.6 | 15.1 | 15.8 | 14.7 | 11.5 | |||
| 2006 | 8.5 | 10.3 | 12..1 | 14.7 | 16.8 | 16.2 | 15.7 | ||||||
| 2007 | 9.8 | 11.4 | 13.7 | 15.5 | 17.6 | 16.2 | 15.7 | ||||||
| 2008 | 10.2 | 11.8 | 14.2 | 16.3 | 17.7 | 16.4 | 15.4 | ||||||
| 2009 | |||||||||||||
| 2010 | |||||||||||||
| 2011 | 13.2 | 15.0 | 15.5 | 15.1 | 14.6 | 13.5 | 11.3 | ||||||
| 2012 | 10.1 | 8.5 | 8.8 | 9.0 | 10.6 | 12.6 | 14.5 | 16.0 | 15.6 | 14.1 | 12.5 | ||
| mean | 10.1 | 8.8 | 8.3 | 8.9 | 10.6 | 12.5 | 14.4 | 15.5 | 15.4 | 14.3 | 12.4 | 11.5 | |
| count | 1 | 2 | 12 | 21 | 22 | 24 | 24 | 24 | 24 | 24 | 17 | 4 | |
| sd | 0.46 | 0.81 | 0.71 | 0.67 | 1.16 | 0.61 | 1.62 | 0.62 | 1.03 | 0.84 | 1.39 |
Source: Cefas and The Wildlife Trust, West Wales